Too many consoles
Engineers switch between Zabbix, PRTG, vRealize and the service desk to understand one incident.
On-premise AI operations management
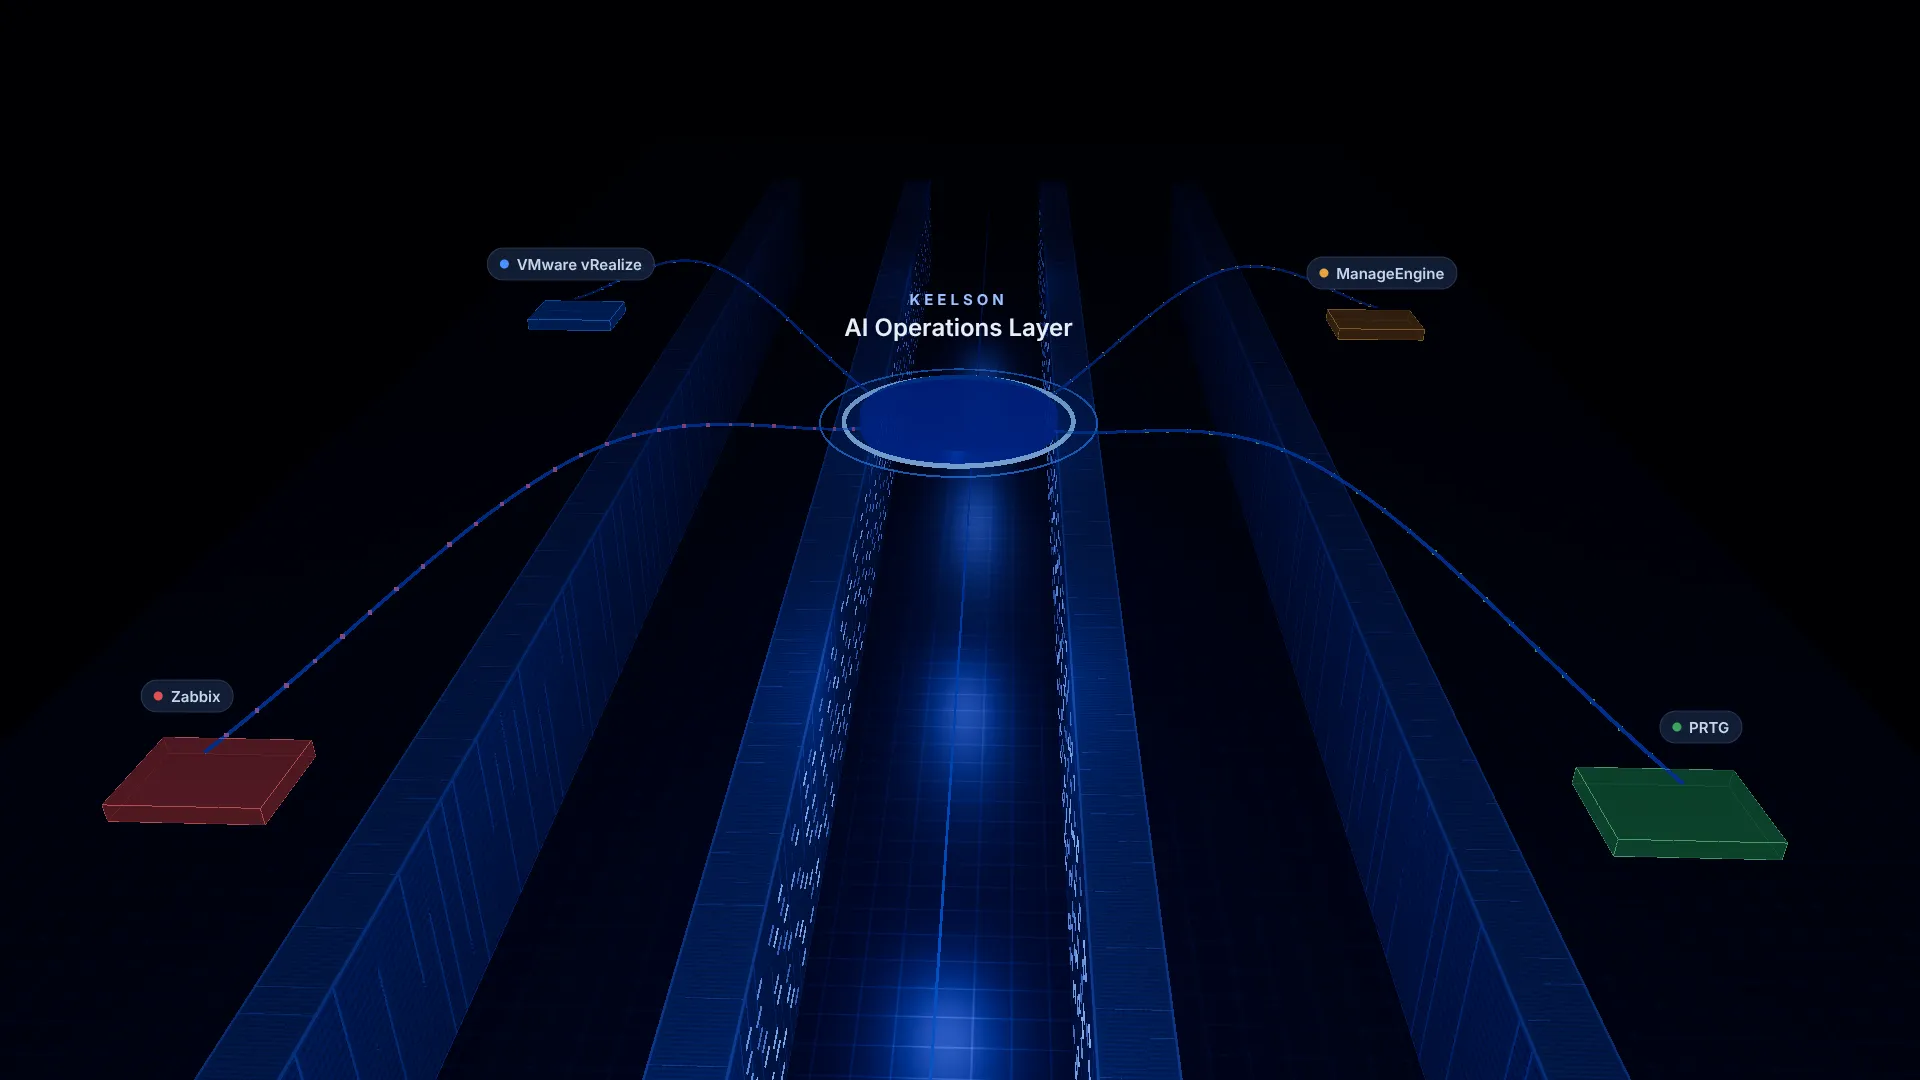
Keelson connects the monitoring, virtualization and service-desk tools you already run, and turns them into one intelligent operations layer — on your infrastructure, under your control.
The challenge
Alerts live in monitoring. Events live in virtualization. Tickets live in the service desk. Nobody has a single view of what matters right now.
Engineers switch between Zabbix, PRTG, vRealize and the service desk to understand one incident.
Alerts are read, classified and routed by hand — slow at night, inconsistent across shifts.
Breaches surface in reports after the fact, not while there is still time to act.
The platform
Keelson sits on top of the tools your teams already trust. It reads their alerts, events and tickets through standard APIs and gives operations one shared picture.
AI agent orchestration
When an alert arrives, the Orchestrator coordinates a small team of agents, each with a narrow, auditable job.
Collects and de-duplicates alerts from every connected source.
Plans the workflow and hands each step to the right agent.
Classifies the incident and routes it to the right team in your ITSM.
Checks every action against your policies and writes it to the audit log.
Informs the engineers on call through the channels you choose.
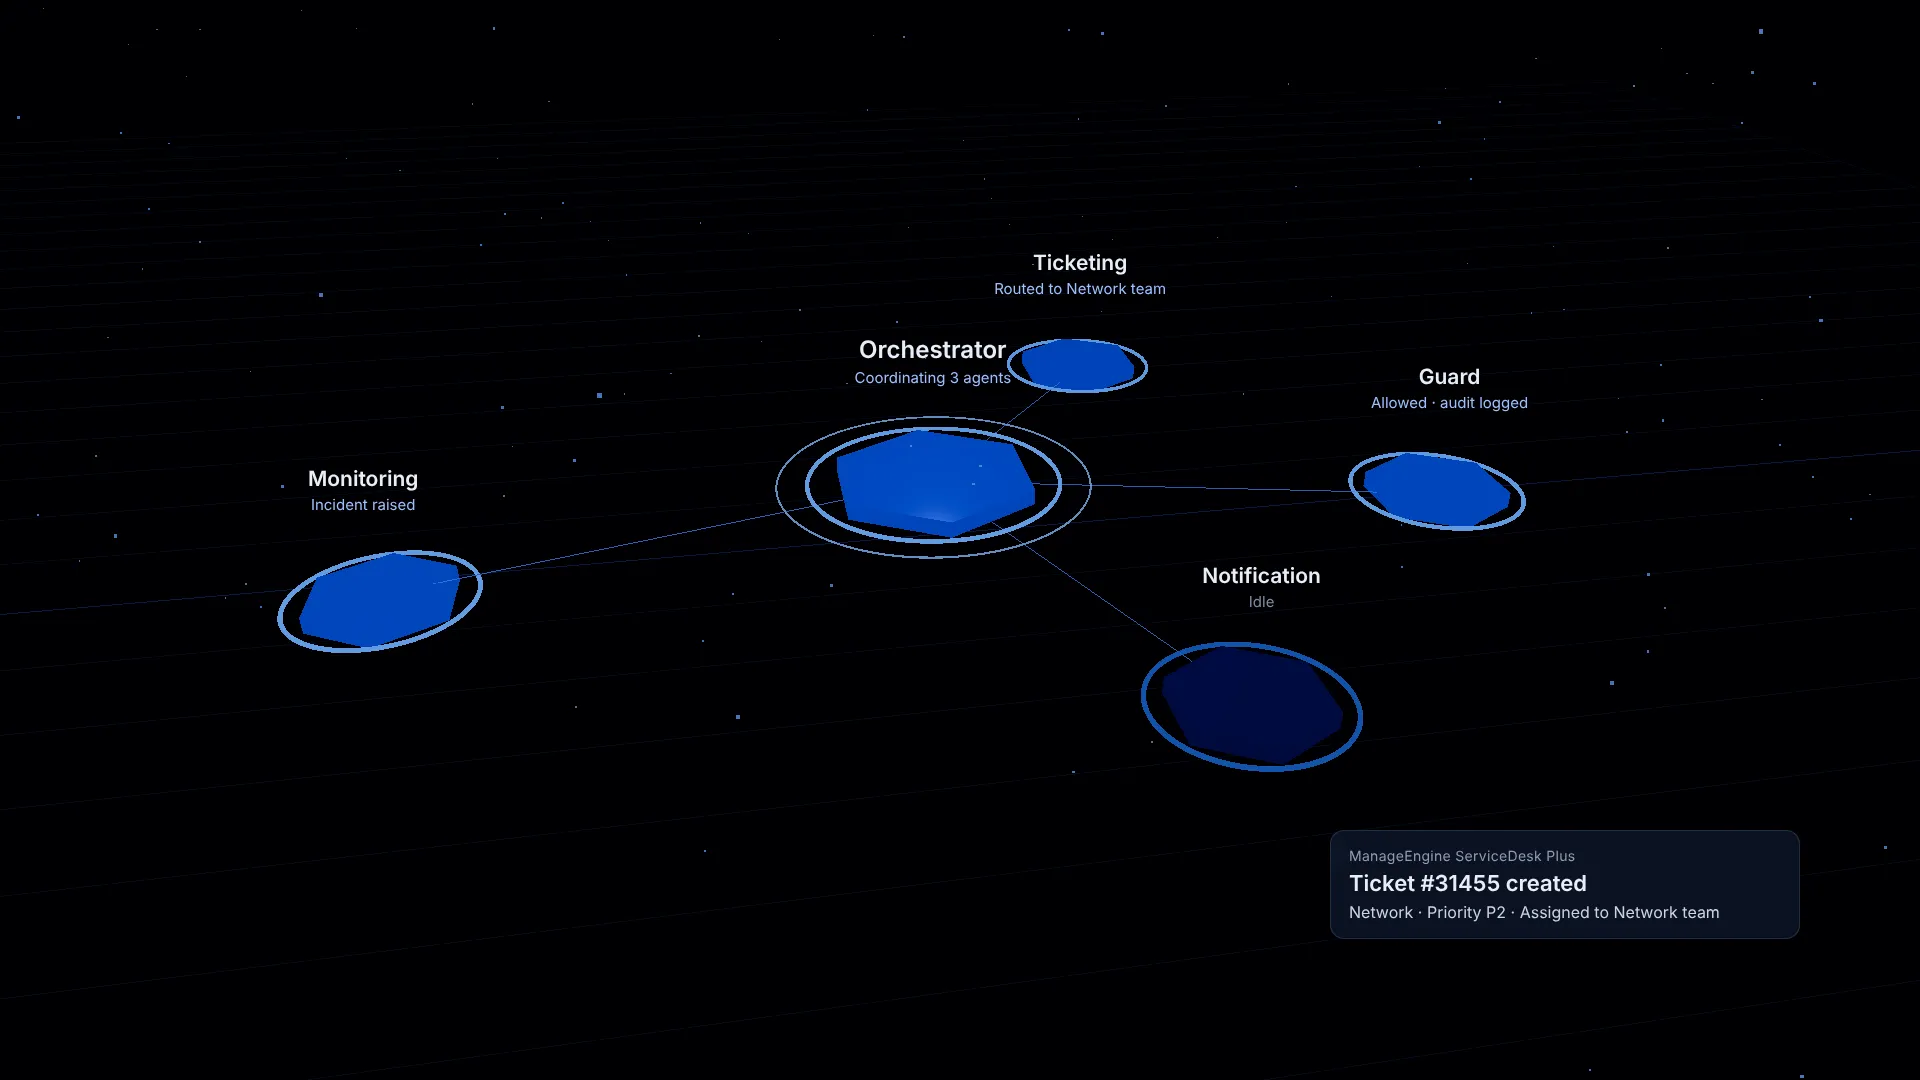
Agents classify, route and notify. Infrastructure changes stay with your engineers.
The control center
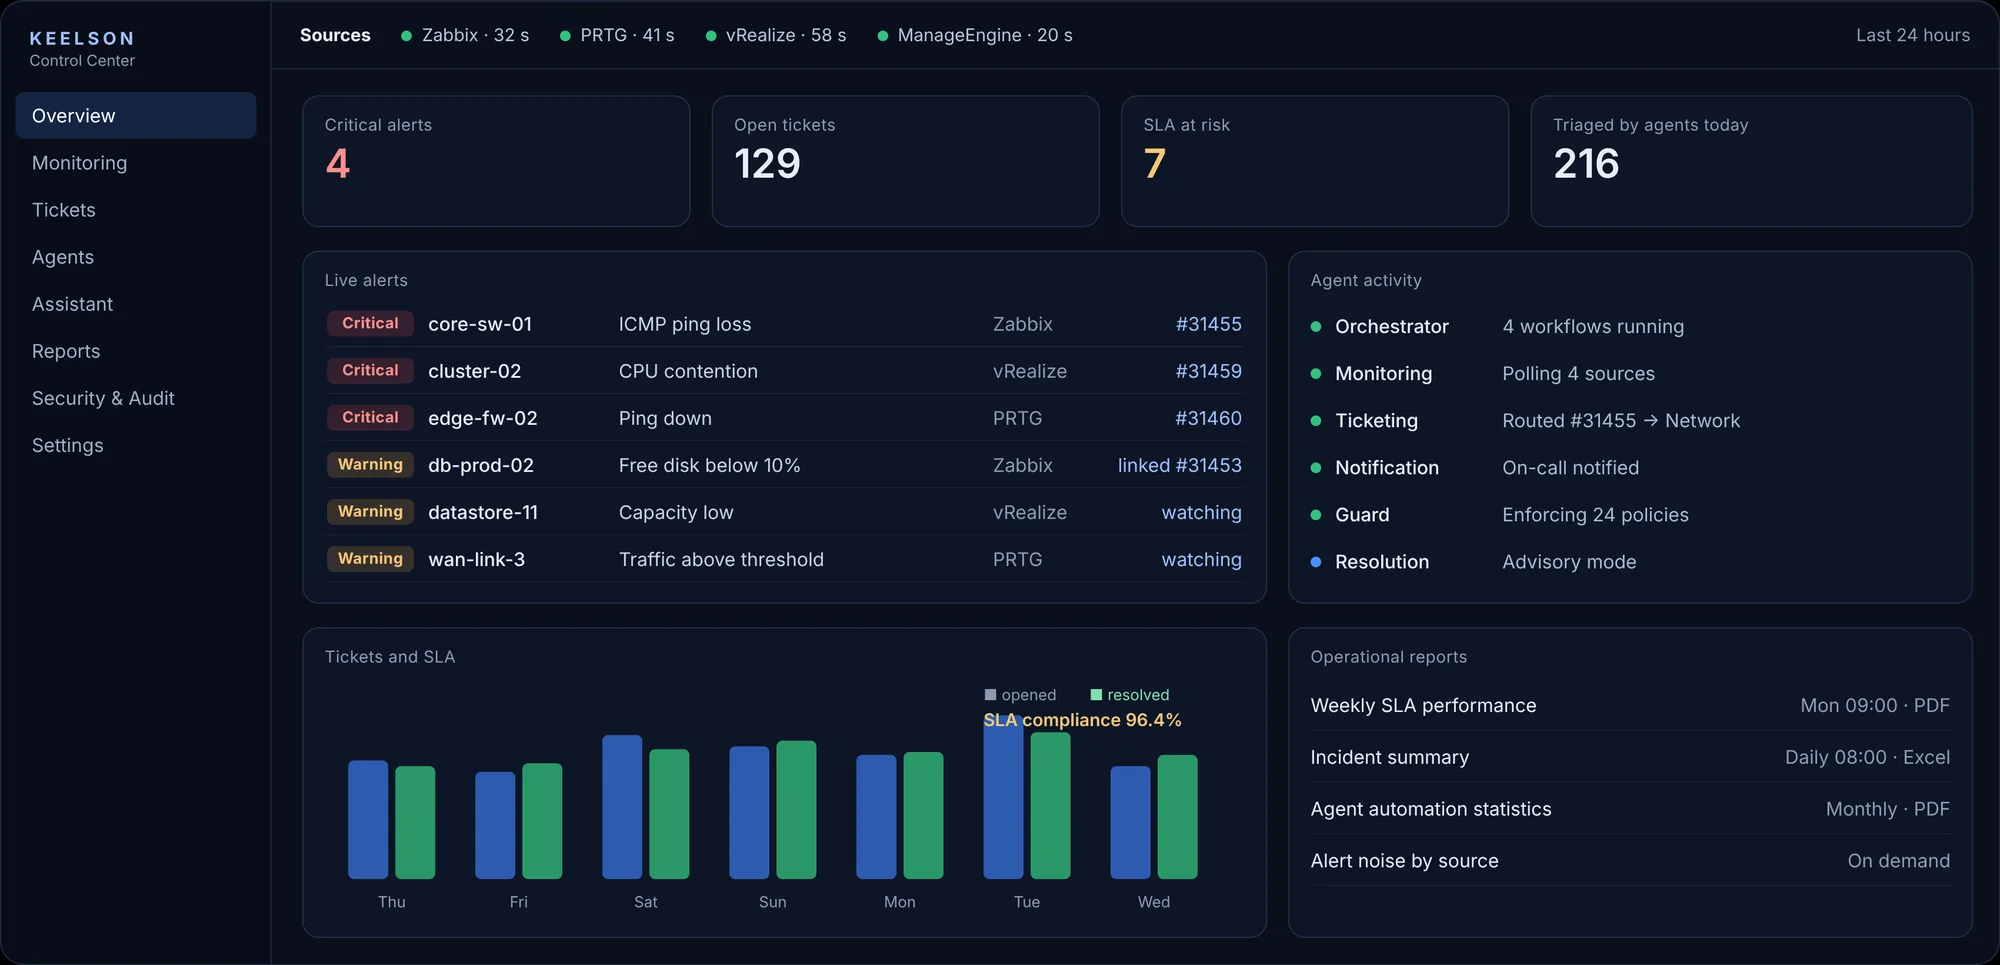
See at a glance which connectors are polling and when they last reported.
One stream across all sources, linked to the tickets they created.
Open work, SLA risk and compliance trends from your service desk.
What every agent is doing, and why — nothing runs out of sight.
Scheduled and on-demand operational reports in PDF or Excel.
Admin, operator, analyst and viewer, each with scoped permissions.
Conversational reporting
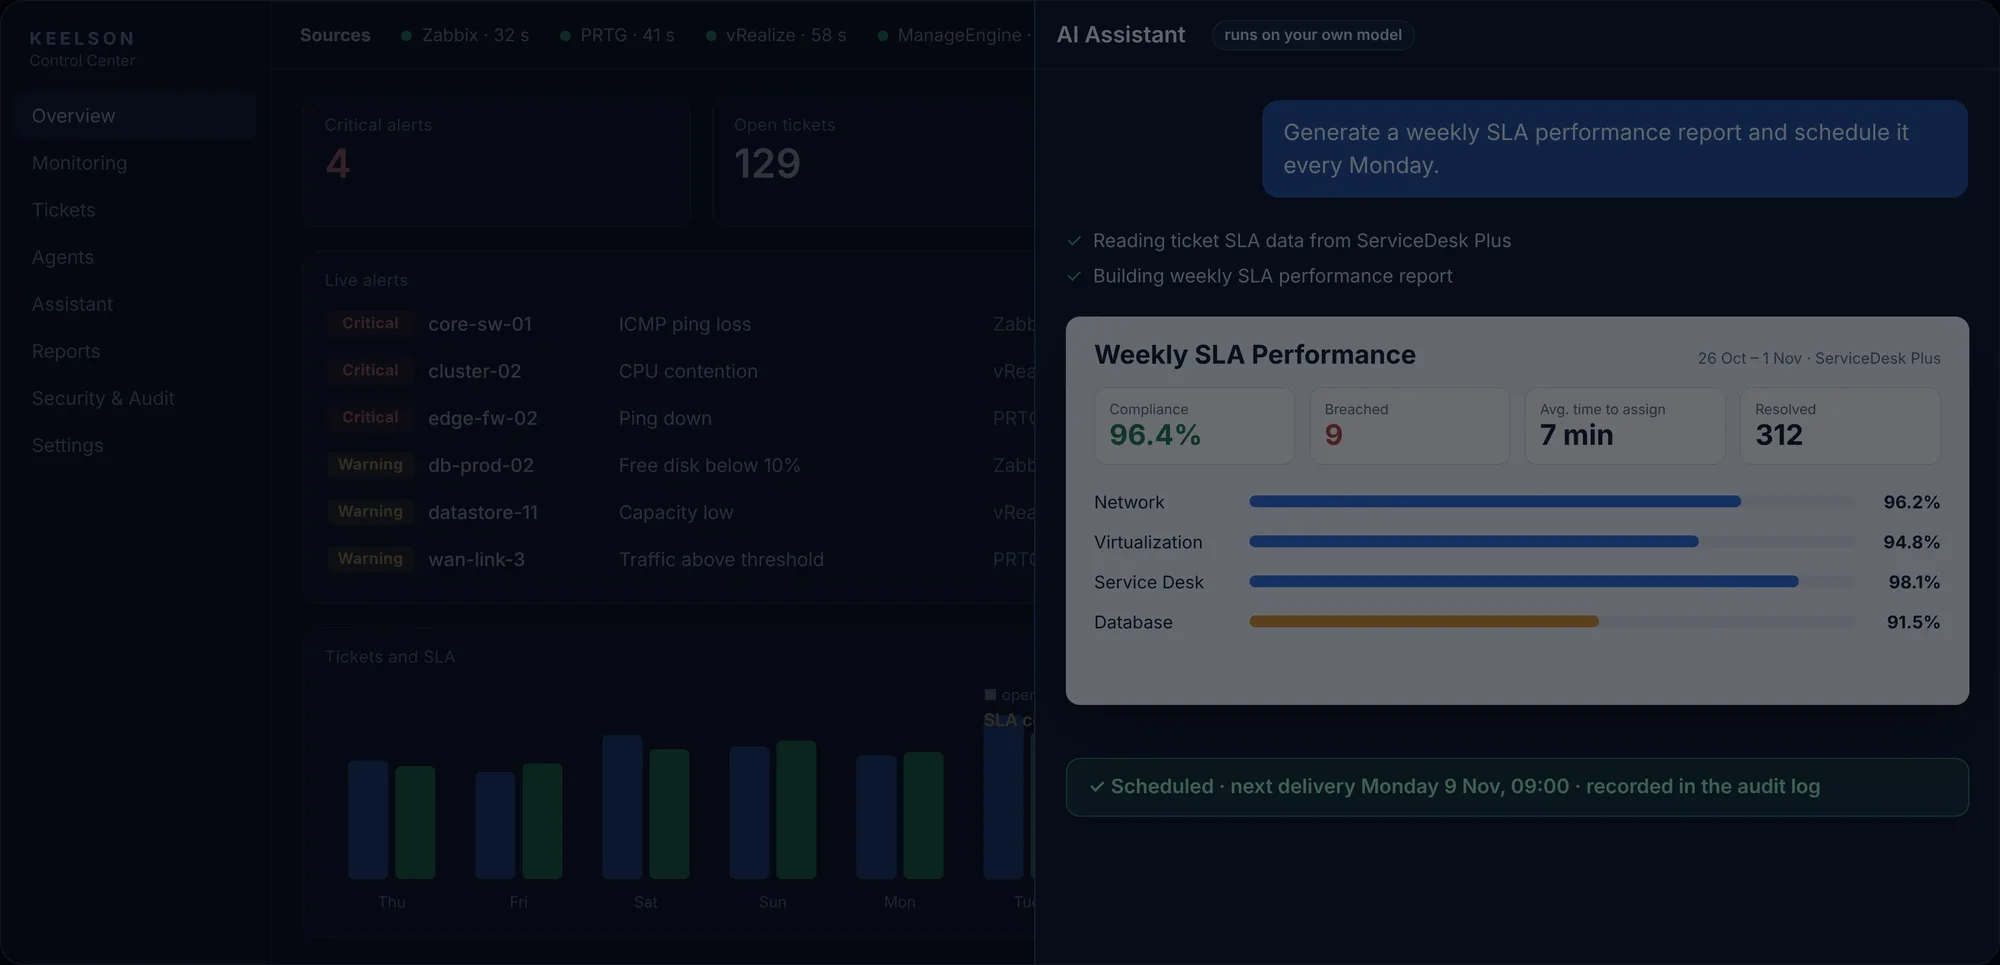
Need a report? Just ask. The assistant reads the data it is permitted to see, builds the report and shows you a preview.
Security & governance
Runs inside your data center, including isolated and offline environments. Operational data does not leave your network.
The assistant and agents run on language models hosted on your infrastructure — no dependency on a public AI service.
A dedicated Guard agent checks every agent action against the policies you define, before it happens.
Anything that changes state — a schedule, a notification rule — waits for an authorized person to approve it.
Every request, decision and approval is logged with who, what and when.
Permissions follow the role. The assistant only sees data the requesting user is allowed to see.
How it works
Deploy Keelson on your own servers or private cloud, alongside your local language model.
Add Zabbix, PRTG, vRealize and ManageEngine as connectors, each with its own least-privilege service account.
Decide which actions agents may take, which need approval, and who can approve them.
Your teams work from the control center; agents handle triage, routing and notification.
FAQ
No. Keelson connects to them and adds a coordination and intelligence layer. Zabbix, PRTG, vRealize and your service desk remain your systems of record.
Yes. Keelson is designed for on-premise deployment, including offline environments, with language models hosted on your own infrastructure.
No. Agents classify, route and notify. Infrastructure changes remain with your engineers. Any state-changing action inside Keelson requires human approval and is written to the audit log.
Current connectors cover Zabbix, PRTG, VMware vRealize and ManageEngine ServiceDesk Plus. Additional connectors can be discussed as part of a pilot.
Request a demo. We will walk through your environment and agree the scope of a pilot on your infrastructure.
Tell us about your environment and we will set up a walkthrough.